
The provided calculation form can be used for the assessment of fatigue resistance of members and connections subjected to dynamic loading. The calculations follow the rules given in EN 1993-1-9 and are valid for the assessment of high-cycle fatigue (> 102 to 104 cycles); this means that stresses and strains remain in the elastic range such that no local yielding occurs.
To execute this tool, the module sen.07 is needed to be able to run SCIA Design Forms User.
To run SCIA Design Forms User, execute DesignForms_User.exe in the installation folder of SCIA Engineer (e.g. C:\Program Files\SCIA\Engineer22.0). Then choose "Load Form" and select the "Fatigue_design_steel_v3.0.clc" file that can be downloaded at the bottom of this page.
Theoretical background
Fatigue checks often relate (1) the stress ranges that occur in a component (i.e. a point) as a result of variable loads, and (2) the number of cyclers that the component can undergo while still sustaining a required load-bearing capacity.
Fatigue load
Fatigue actions should be determined according to the requirements for fatigue assessment; these are different from the actions for ultimate limit state and serviceability limit state verifications. Fatigue loads and stresses should be calculated at the serviceability limit state level as a result of variable actions only.
Fatigue loads can be determined according to EN 1991 – the fatigue actions in EN 1991 are upper bound values based on evaluations of measurements of load effects, which conform to the rules in Annex A of [1]. If no fatigue model is available in EN 1991, Annex A in [1] or specific fatigue loading models from National Annexes may be used.
Stress ranges for fatigue verification
Fatigue loads are most often represented in terms of resulting stress ranges – direct (normal) or shear stresses are most often considered; it is possible to check for fatigue based on principal stress.
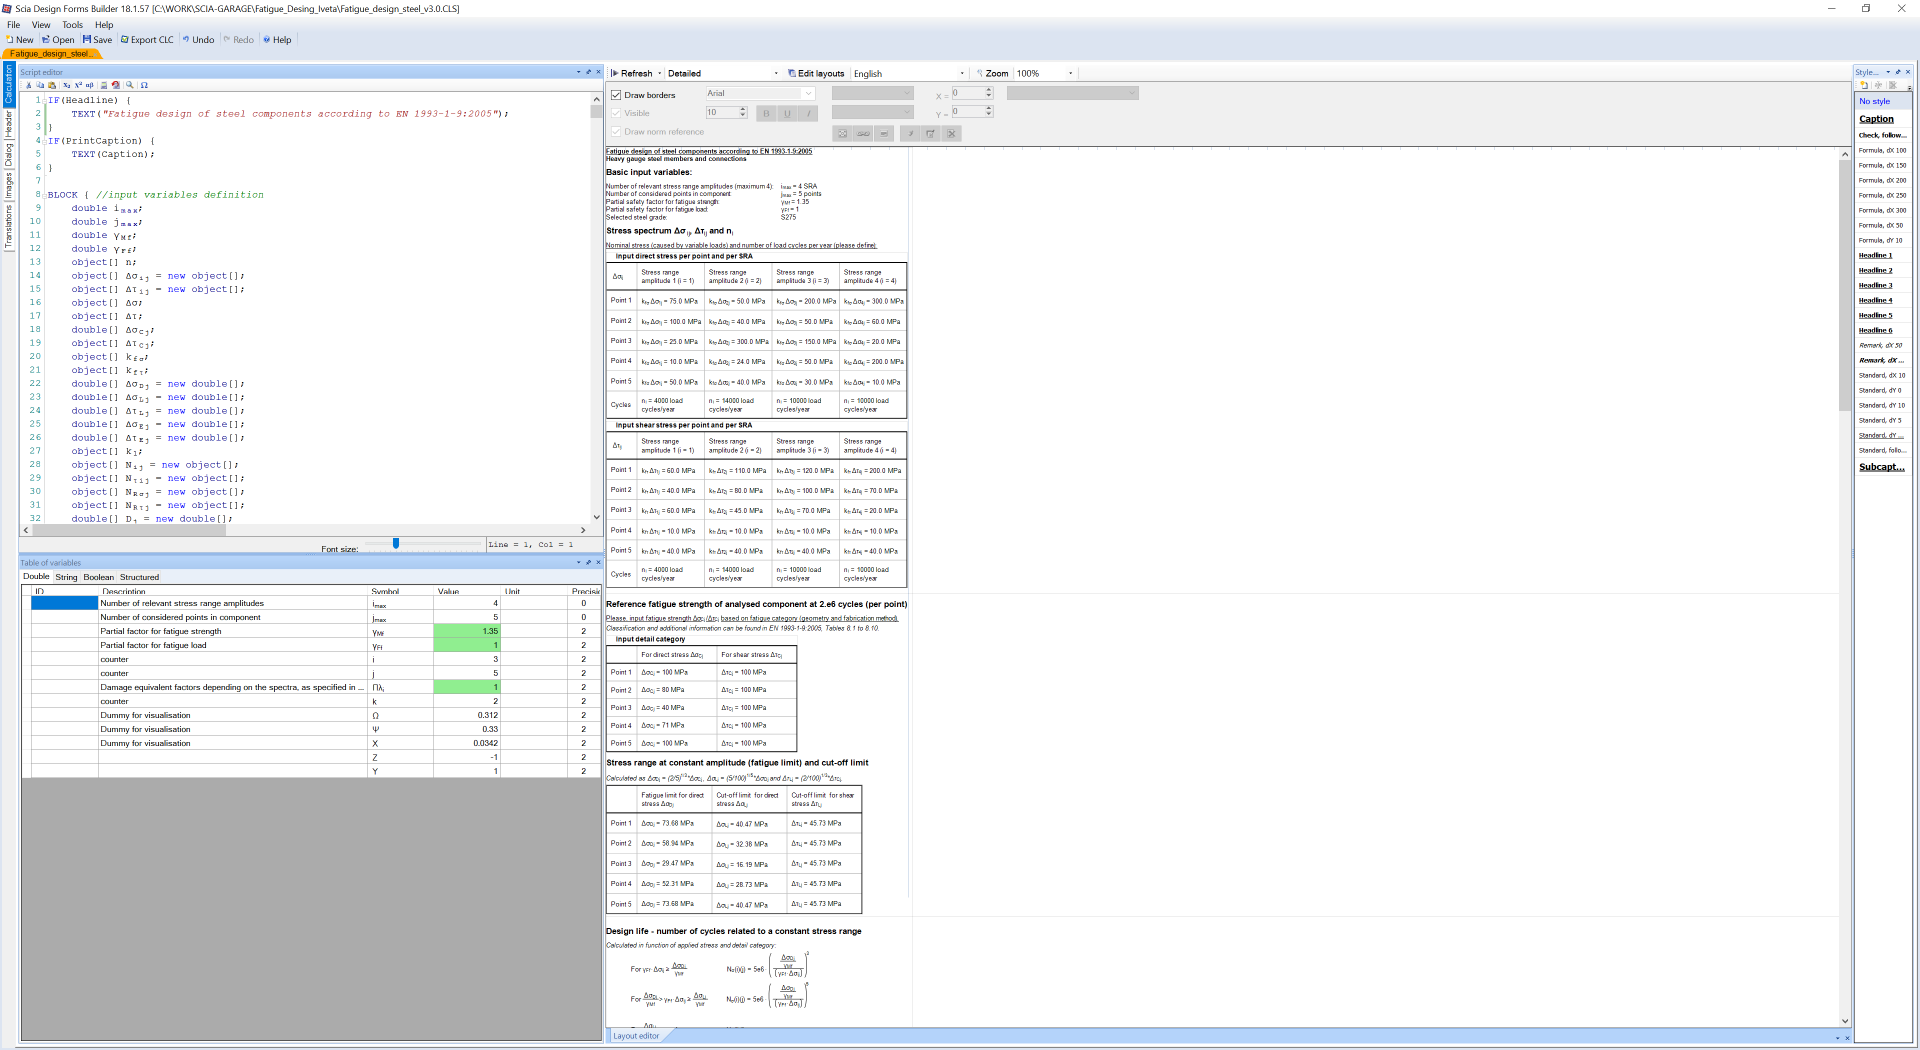
Because stresses are often derived from some type of a numerical model, one should distinguish between (1) nominal stress, (2) hot-spot stress, and (3) notch stress ranges.
- Nominal stress is stress in the parent material or in a weld adjacent to a potential crack location, calculated in accordance with elastic theory excluding all stress concentration effects.
Nominal stresses are derived from simplified beam models or from coarse FEM models. Stress concentrations resulting from the gross shape of the structure are included in the nominal stress. Nominal stresses may be multiplied by an appropriate stress concentration factor kf to allow for a geometric discontinuity that has not been taken into account in the classification of a particular structural detail (classification is given in Tables 8.1 to 8.10 in [1]).
- Structural hot-spot stress (also called geometric stress) is the maximum principal stress in the parent material adjacent to the weld toe, taking into account stress concentration effects due to the overall geometry of a particular constructional detail. Hot-spot stresses include nominal stresses and stresses from structural discontinuities. The latter are not due to the presence of welds (they are extrapolated using various methods from the points at certain distance away from the weld toe) [2];
- Notch stresses are the total stress at a weld toe and include the structural stresses and the stresses due to the presents of welds. FEM analysis with solid elements can be used to calculate the notch stress, although a very fine mesh would be necessary. [1] does not require the use of notch stress, as notch effects are taken into account indirectly in the experiments.
When fatigue strength is determined according to Table 8.1 to Table 8.10 in [1], nominal stress ranges should be used in the fatigue verification. Effects producing stress concentrations in details other than those included in Table 8.1 to 8.10 (abrupt changes of section that occur close to the crack initiation site) should be taken into account by using stress concentration factors kf according to §6.3 of [1]. kf values may be taken from handbooks or from appropriate finite element calculations.
Nominal stresses should be calculated at the site of potential fatigue initiation.
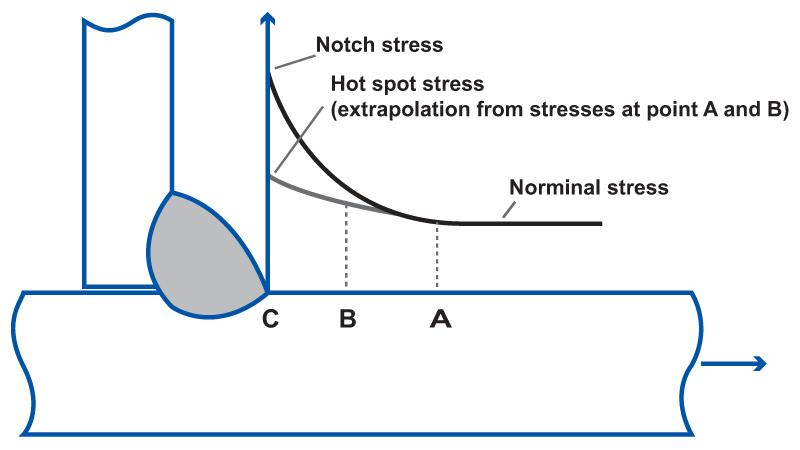
Figure 1. Stress distribution at welded joints
For the fatigue verification of welds according to the hot-spot method, local concentration effects (e.g. from the weld profile shape) are taken into account in the detail classification in Table B.1 of [1].
Relevant stresses for fatigue verification of details are:
- In the parent material:
- Nominal direct stresses σ;
- Nominal shear stresses τ;
- Combined nominal stresses are verified according to the equivalent stress method according to §8.2 in [1].
- In the welds:
-
Normal stresses σwf transverse to the axis of the weld ;
-
Shear stresses τwf longitudinal to the axis of the weld .
-
Stress history and stress spectra
A stress history is the record (or calculation) of the stress variation at a particular point in a structure during a loading event. Stress history at the structural detail under consideration should be determined taking into account relevant influence lines and the effects of dynamic magnification of the structural response.
The simplest way to represent fatigue stresses is the constant-amplitude load fluctuation (see Figure 2). Such load models have been widely used in the past and are still behind many of the contemporary formulations for fatigue design. This kind of simple load history may occur in machinery parts – like in shafts and rods in steady-state rotation.
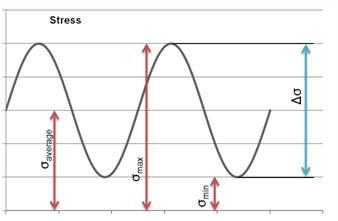
Figure 2. Constant-amplitude load fluctuation.
A constant-amplitude stress range is described as Δσ = σmax - σmin. Other methods for range description exist that take into account the sign of stresses, but these are not used in EN 1993-1-9:2005.
Stress histories with variable amplitude are more complex. Figure 3a shows a typical example. Often, it is not likely that the same sequence and magnitude of stress ranges recur often, and an analytical representation of the load cannot be defined. Such loads occur on many structures, such as traffic loads on bridges, wave loads on ships and offshore platforms, etc.
A method to handle multiple-amplitude fatigue loads (also recommended by EN 1993-1-9:2005) is explained in the following paragraphs.
A stress spectrum is a histogram that shows the number of occurrences per amplitude of the stress ranges (see Figure 3b). A design stress spectrum is the total of all stress range spectra in the design life of a structure that are relevant to the fatigue assessment. Stress range spectra may be modified by neglecting (1) peak values of stress ranges representing less than 1% of the total damage, and (2) low stress ranges that do not contribute to the overall damage (below the cut-off limit ΔσL, see further).
When using the design spectrum the applied stress ranges Δσi should be multiplied by γFf and the fatigue strength values ΔσC divided by γMf when obtaining the fatigue life Ni (endurance) for each block in the spectrum. γFf is the partial safety factor for fatigue load and its value are provided in 1991-1-1 [3]. A value of γFf = 1.0 is widely accepted in design calculations.
Methods for the derivation of stress range spectra from stress histories are the Rainflow method, the Reservoir method (these are recognised by the EUROCODE, see annex A of [1] for further information).
To handle complex loads, EN 1993-1-9:2006 assumes linear damage according to the Palmgren-Miner rule. The method rests on the following assumptions (see Figure 3):
- The irregular load can be replaced by a sequence of blocks, each block containing cycles with the same stress range amplitude; a block is represented by a limited number of cycles;
- If (1) ni is the number of cycles with a particular stress range amplitude Δσi imposed on a component, and (2) Ni is the total number of cycles with this particular stress range amplitude Δσi that are necessary to cause fatigue failure, then gives the fraction of damage per block;
- The order in which the blocks of different stress range amplitudes are imposed does not affect the fatigue life;
- Failure occurs when the linear sum of damage for each load level reaches a critical value (equal to 1 in most cases).
This means that the linear damage method has some limitations, in particular assuming sequence independence and assuming independence of damage accumulation.
Figure 3. Scheme of Palmgren-Miner’s rule: a) stress history; b) stress spectrum; c) Δσ-N graph.
Thus, failure due to one of the stress range amplitudes occurs when:
is the damage caused by a single cycle at stress range level Δσi. represents the accumulated damage due to ni cycles with stress range amplitude Δσi. A cumulative damage assessment presumes that and that full damage occurs when D reaches 1.0.
Cumulative damage assessment is performed when the maximum stress range due to variable loading is higher than the constant amplitude fatigue limit ΔσD (see further).
Fatigue strength
EN 1993-1-9:2006 expresses fatigue strength as the intensity of variable stress Δσ (or Δτ) that causes failure after NC = 2 million cycles. The fatigue strength is referred to as “Detail Category” or “Reference value of the fatigue strength” and is designated as ΔσC (or ΔτC).
Values for ΔσC (and ΔτC) are derived based on test results from specimens with various geometry, steel grades and loaded states. These values can be found in Tables 8.1 to 8.10 of EN 1993-1-9:2006 [1].There, additional requirements/assumptions may be indicated per component type where appropriate – how should the stress range be quantified, whether supplementary requirements should be placed on the detailing and inspection, etc. The tables include informative schemes, where the probable site of crack initiation is also indicated.
Because experimental results were used to derive the fatigue strength, in most cases it is not necessary to increase the stress with concentration factors due to complex joint geometry. The standard stipulates though that nominal stresses should be multiplied by appropriate stress concentration factors kf to allow for geometric discontinuity that has not been taken into account in the classification of a particular constructional detail.
The detail categories in tables 8.1 to 8.10 of [1] correspond to characteristic fatigue strength. This means that appropriate partial safety factors for material strength γMf should be adopted based on the function and importance of the structure (see Figure 4).
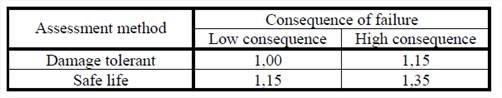
Figure 4. γMf factors for fatigue strength.
The assessment methods included in this calculation form and [1] apply to all grades of structural steel, stainless steels and unprotected weathering steels except where noted otherwise in the detail category tables. Nevertheless, steel materials should conform to the toughness requirements of EN 1993-1-10. Size effects due to thickness or other dimensional effects may need to be taken into account according to §7.2.2 and Tables 8.1 to 8.10 in [1].
Fatigue limit and cut-off limit
The fatigue (endurance) limit ΔσD is the maximum stress range that can be repeated an infinite number of times on a test specimen without causing a failure. If all significant stress ranges acting on a component are with uniform amplitude, then the purpose of fatigue design may be to keep the stress due to cyclic loading below that fatigue limit. This structural component can be designed for limited life when the stress range in kept below the fatigue strength ΔσC, or for infinite life when the stress range is kept below the fatigue limit ΔσD.
When variable amplitude loading is applied, the stress ranges lower than the fatigue limit may still cause damage due to the fact that larger amplitude cycles may initiate cracks that will be later propagated by the cycles with lower stress range amplitudes.
To overcome this shortcoming in the Palmgren-Miner’s rule, [1] adopts a sloped line after the fatigue limit ΔσD, instead of a horizontal line that corresponds to fatigue life of infinite number of cycles. The sloped parts of all fatigue strength curves (for both direct and shear stress) in [1] end at the cut-off limit ΔσL or ΔτL. Stress ranges in the design spectrum below the cut-off limit (ΔσL) do not contribute to the calculated cumulative damage.
Fatigue life
The fatigue life is the period of time predicted to cause fatigue failure under the action of the design spectrum. The total fatigue life, Nσ (or Nτ), is defined as the sum of the number of cycles to initiate a fatigue crack, Ninit, and the number of cycles to propagate a fatigue crack to a critical size, Nprop.
Δσ-N methods for evaluating fatigue life
The simplest and most common method for estimating fatigue life is the nominal stress method. It is adopted in EN 1993-1-9:2006, where standard σ-N curves are used in the fatigue assessment per category of structural detail. Fatigue assessment methods other than the σ-N methods as the notch strain method or fracture mechanics methods are not covered by [1].
Δσ-N curves quantify the relationship between the stress range and number of load cycles to fatigue failure (see Figure 5). Each Δσ-N curve corresponds to a detail class (an assembly or joint type, e.g. longitudinal welds in welded sections, lattice girder node joints, etc.). Δσ-N curves are derived based on experimental investigations – fatigue tests with large specimens, that include effects of geometrical and structural imperfections from material production and execution (e.g. the effects of tolerances and residual stresses from welding). Curves have been collected from several previously available standards, guidelines and technical publications [2].
When the Δσ-N curves are printed in logarithmic scale (log(Δσ) vs. log(N) or log(Δτ) vs. log(N)) these become bi-linear or tri-linear graphs (see Figure 5).
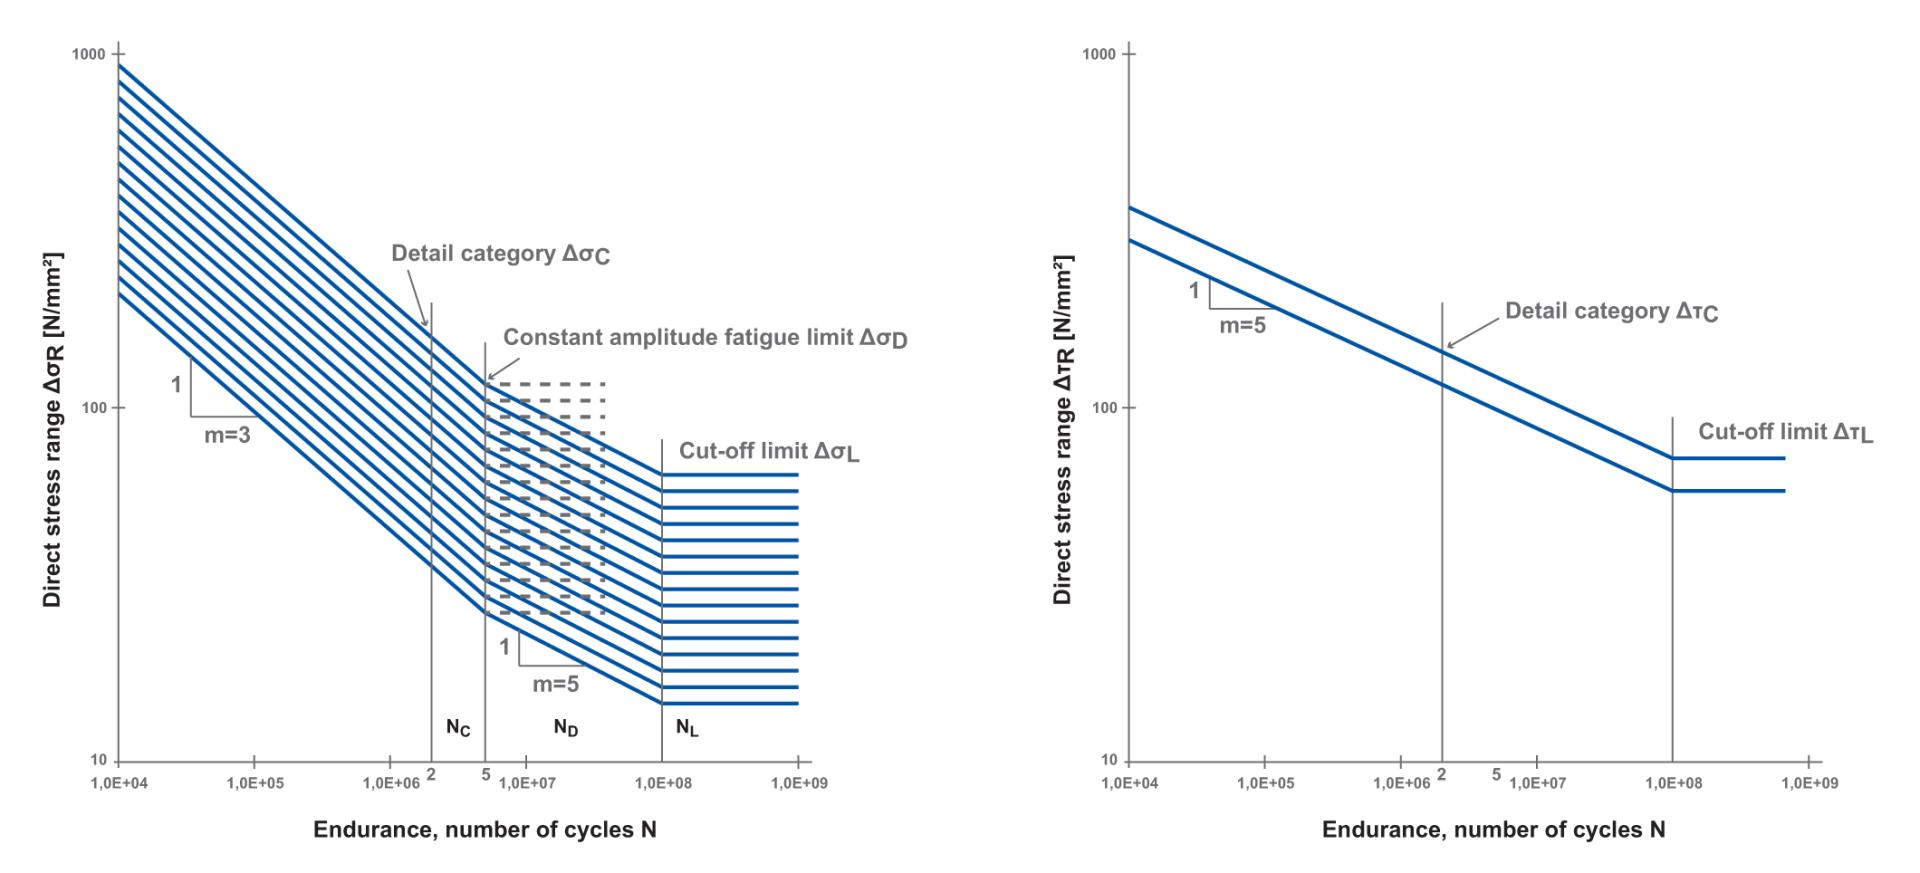
Figure 5. Fatigue strength curves for a) direct stress ranges; b) shear stress ranges [1].
A Δσ-N curve describes the behaviour of a typical detail category; each detail category is designated by its fatigue strength ΔσC at 2 million cycles (i.e. NC = 2 x 10⁶ cycles). The values given are in N/mm2 and are rounded. The number of cycles corresponding to the constant amplitude fatigue limit ΔσD is 5 million cycles, i.e. ND =5 x 10⁶. The number of cycles corresponding to the cut-off limit ΔσL is 108 cycles, i.e. NL = 108.
Nominal shear stress ranges Δτ are treated similarly to nominal direct stress ranges - Δτ-N fatigue strength curves are used but using a single slope constant m = 5 (see Figure 5b). These curves are based on representative experimental investigations and thus include the effects of local stress concentrations due to the weld geometry, size and shape of acceptable discontinuities, the stress direction, residual stresses, metallurgical condition, and in some cases, the welding process and post-weld improvement procedures [2].
An important stage in evaluating fatigue resistance is obtaining the design life Ni (also called endurance) as number of cycles under the action of a constant amplitude stress history (Δσi). The σ-N curves for the corresponding detail category should be used as follows (the i-index refers to stress range amplitude):
Equivalent constant amplitude stress range
On the basic of equivalence of D (damage), the design stress range spectrum may be transformed into any equivalent design stress range spectrum, e.g. a constant amplitude design stress range spectrum ΔσE,2 yielding a fatigue equivalent load associates with a design life of NC = 2x10⁶.
The equivalent constant amplitude stress range ΔσE,2 is defined as the stress range that would result in the same fatigue life as for the spectrum of variable amplitude stress ranges when the comparison is based on the Miner’s summation. The rules for the derivation of ΔσE are given in Annex A of [1].
A simplified procedure for the determination of equivalent constant amplitude stress ranges is given in §6.2 of [1], where the use of damage equivalent factors is allowed.
In [1]: where Δσ(γFfQk) and Δτ(γFfQk) are the design stress ranges caused by the fatigue loads specified in EN 1991; Qk is the characteristic value of the loads according to EN 1991; λi are damage equivalent factors that convert the complex load history to a single amplitude stress range.
Appropriate values for λi should be found in literature – technical publications and brochures, manuals of large machinery that causes dynamic loads in the supporting structure, etc. Where no appropriate data for λi are available, the principles of Annex A of [1] should be used.
Equivalent stress ranges for latticed girders from hollow sections
For latticed girders made of hollow sections the modelling may be based on a simplified truss model with pinned connections. Provided that the stresses due to external loading applied to members between joints are taken into account, the effects from secondary moments due to the stiffness of the connection can be taken into account by the use of k1 factors (see Table 4.1 in [1] for circular sections, and Table 4.2 in [1] for rectangular sections).
The use of k1 factors avoids the need to perform a more accurate calculation of the effect of moments in the joint. The design value of the modified nominal stress range γFfΔσE,2 in this case, should be determined according to
Where is the design value of the stress range calculated with a simplified truss model with pinned joints; k1 is the magnification factor from Table 4.1 and 4.2 in [1].
Fatigue verification at 2 million cycles
Nominal or modified nominal stress ranges due to frequent loads should not exceed:
- for direct stress ranges
- for shear stress ranges
How to use the calculation form
The dialogue
The calculation form performs fatigue verifications for heavy gauge steel components according to EN 1993-1-9:2005. Numerous points on the component may be checked using design stress range spectrum that includes up to four significant stress range amplitudes. An assessment of the fatigue life in years is executed, as well as a fatigue verification at equivalent stress ranges.
An infinite number of points on the component can be considered. The form consists of (1) a dialogue, where all input is defined, and (2) a layout window, where the calculation reports are displayed.
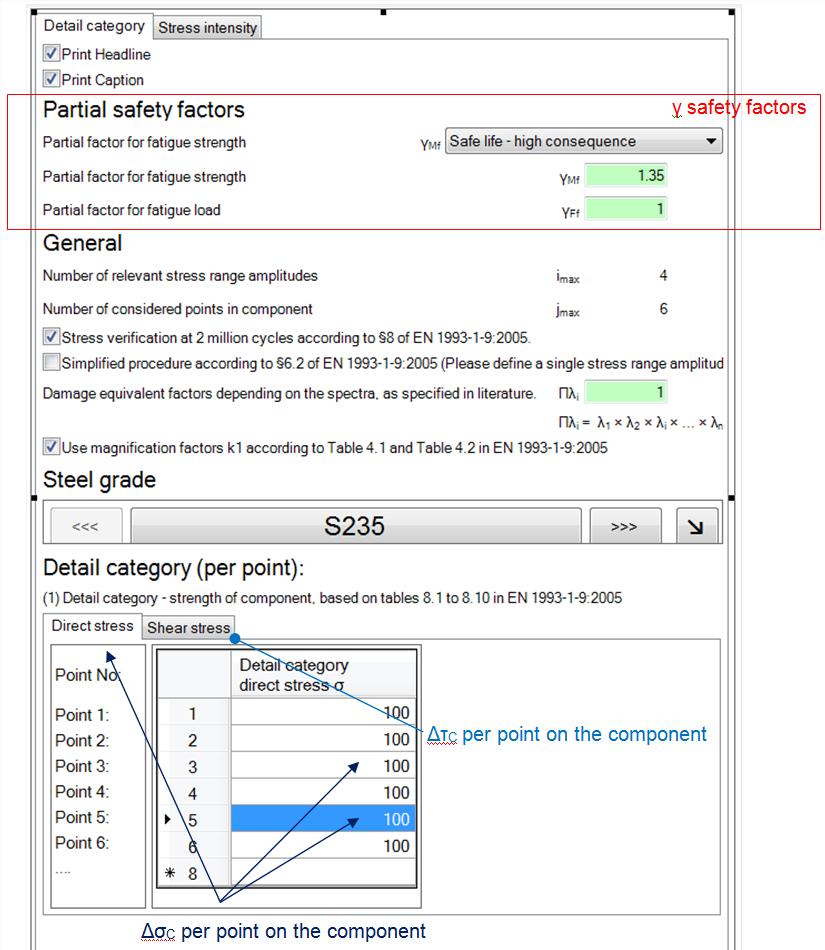
The GUI of the dialogue is organized in two tabs – “Detail Category” and “Stress intensity”. On the detail category tab, the safety factors for fatigue strength γMf and for fatigue loading γFf are defined. The detail category for direct and shear stress is defined per point on the component in the first and second tab of the “Detail category (per point)” box.
A few additional options for the calculation are added to this tab. Selecting “Stress verification at 2 million cycles according to §8 of EN 1993-1-9:2005.” specifies whether equivalent constant amplitude stress ranges will be calculated, and fatigue verification in terms of stress will be performed. If the option is switched off, only the design life in number of cycles Nij and years Dj will be calculated.
The following option “Simplified procedure according to §6.2 of EN 1993-1-9:2005.” specifies which method should be used to determine ΔσE,2 and ΔτE,2 – if the option is switched on, input stress will be multiplied by a damage equivalent factor . Values for can be found in literature.
If using this simplified procedure, one should define a single stress range amplitude as the method presumes that one works with a uniform stress range spectrum. If the option is switched off, the method from Annex A in [1] will be used in the determination of equivalent stress ranges.
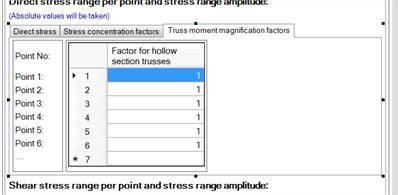
Also, there is a possibility to enter k1 factors for the design of lattice girders of hollow sections. To use magnification factors k1 in the design of trusses, switch on the option “Use magnification factors k1 according to table 4.1 and Table 4.2 in EN 1993-1-9:2005”. After setting the option on, a table appears in the third tab of the “Detail category (per point)” box. There, k1 factors may be defined per point on the component.
The second tab “Stress intensity” contains input related to the fatigue load. The number of cycles is defined per stress range amplitude. Only four different amplitudes can be considered simultaneously in this version of the form. After transforming the stress spectrum to design stress spectrum usually a very limited number of stress range amplitudes are left to be considered.
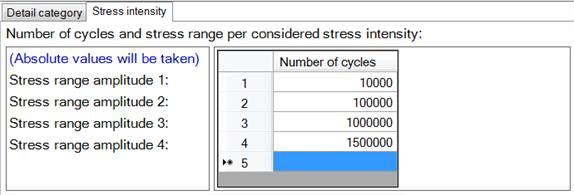
If ‘number of cycles’ for more than four stress range amplitudes are defined, an error message is sent to the user and the calculation is aborted. To consider less than four stress range amplitudes, fill in only the needed rows in the “Number of cycles” table and delete the rest (select the entire row and press the DEL key).
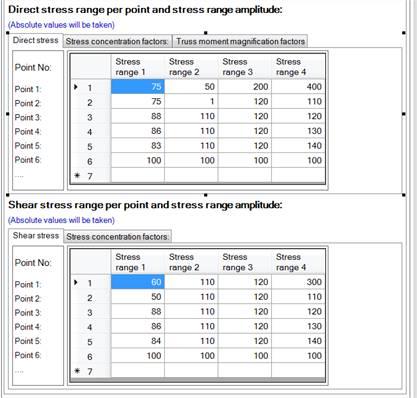
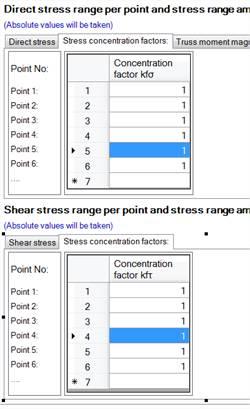
Input direct and shear stress ranges are defined in the following tables of the dialogue. These are defined per point and stress range amplitude. Stress concentration factors are defined on the second tab of the corresponding input table.
If number of cycles are not defined for all four stress range amplitudes (the “Number of cycles” input table contains less than 4 rows), the corresponding columns in the “Direct stress range per point…” and “Shear stress range per point…” tables will be ignored.
Absolute values of the defined input will be taken for number of cycles, stress ranges and stress concentration factors. These quantities only make sense if positive in the implemented design methodology.
Layout
The SDF USER application displays calculation reports in the Layout Window. The calculation form for fatigue verification supports three different layouts – a detailed, a standard, and a brief layout. The detailed layout contains a description of all calculation steps, formulas and input parameters included. The standard layout is an informative report of the fatigue verification, where most of the relevant information is presented in a more summarised fashion. The brief layout sums up the design on a single page, although if many points were defined, the brief layout may need to be printed on more pages.
The following pages explain what has been included in the different report layouts.
Detailed layout
1. Input summary:
- basic input variables – safety coefficients, steel grade, number of points on the component, number of amplitudes in the stress range spectrum;
- stress spectrum for direct and shear stress;
- reference fatigue strength at 2 million cycles ΔσCj/ΔτCj for each point on the component.
2. Intermediate calculation steps in the determination of the design life:
- calculation of fatigue limit ΔσDj / ΔτDj and cut-off limit ΔσLj / ΔτLj (per point j);
- calculation of design life related to a constant stress range – Nσij and Nτij;
- calculation of damage per year related to a constant stress range Dσij and Dτij;
- total damage per year on the points on the component – as a result of direct stress, shear stress and combined;
3. Results:
- design life at each point on the component.
4. Intermediate calculation steps for fatigue verification at 2 million cycles:
- calculation of equivalent design life as the number of cycles related to a constant stress ranges ΔσE,2j/ΔτE,2j;
- calculation of equivalent constant amplitude stress range at 2 million cycles;
5. Results of fatigue verification:
- fatigue verification at equivalent stress ranges ΔσE,2j and ΔτE,2j.
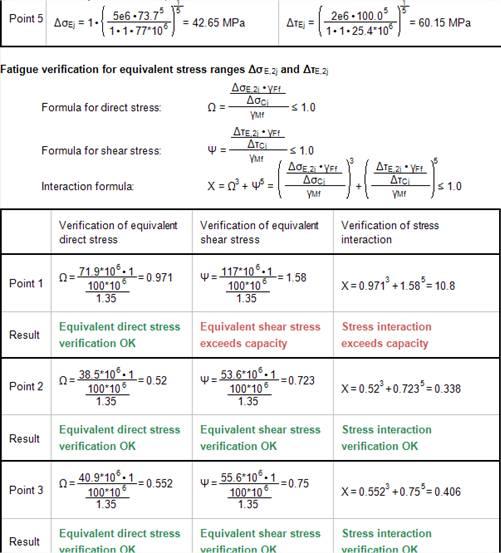
Figure 6. Detailed layout (screenshot).
Standard layout
1. Input summary:
- basic input variables – safety coefficients, steel grade, number of points on the component, number of amplitudes in the stress range spectrum;
- tabulated summary of the input stress spectrum.
2. Intermediate values relevant to the calculation of design life:
- tabulated detail category ΔσCj/ΔτCj, fatigue limit ΔσDj / ΔτDj and cut-off limit ΔσLj / ΔτLj;
- design life and damage per year related to a constant stress range – Nσij and Nτij;
3. Results:
- damage per year and design life of component;
4. Intermediate values relevant to the fatigue verification at 2 million cycles:
- Equivalent direct stress ranges ΔσE,2j/ΔτE,2j;
5. Results of fatigue verification:
- Unity check values for direct stress, shear stress and stress interaction.
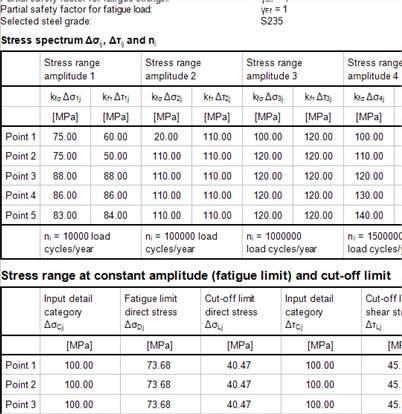
Figure 7. Standard layout (screenshot).
Brief layout
- Design life expressed as number of cycles related to a constant stress range;
- Damage per year at each point on the component (as a result of (1) direct stress, (2) shear stress, and (3) stress interaction;
- Fatigue verification at 2 million cycles – unity check values for (1) direct stress, (2) shear stress, and (3) stress interaction.
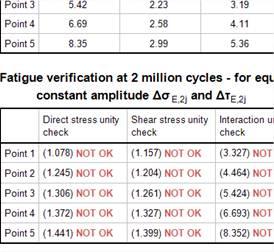
Figure 8. Brief layout (screenshot)
References
- European committee for standardization, Eurocode 3: Design of steel structures - Part 1-9: Fatigue, Brussels, Belgium, 2005.
- Wei Lu and Pentti Mäkeläinen, Advanced Steel Structures – Part 2: Fatigue Design; Research report, Helsinki University of Technology Laboratory of Steel Structures Publications 29, 2003.
- European committee for standardization, Eurocode 1: Actions on structures - Part 1-1: General actions - Densities, self-weight, imposed loads for buildings, Brussels, Belgium, 2005.
This is not official SCIA software and these community addons are delivered without any warranty or guarantee. So always verify the imported data. If you have any feedback, comments, requests, please feel free to contact us at our e-mail [email protected].