
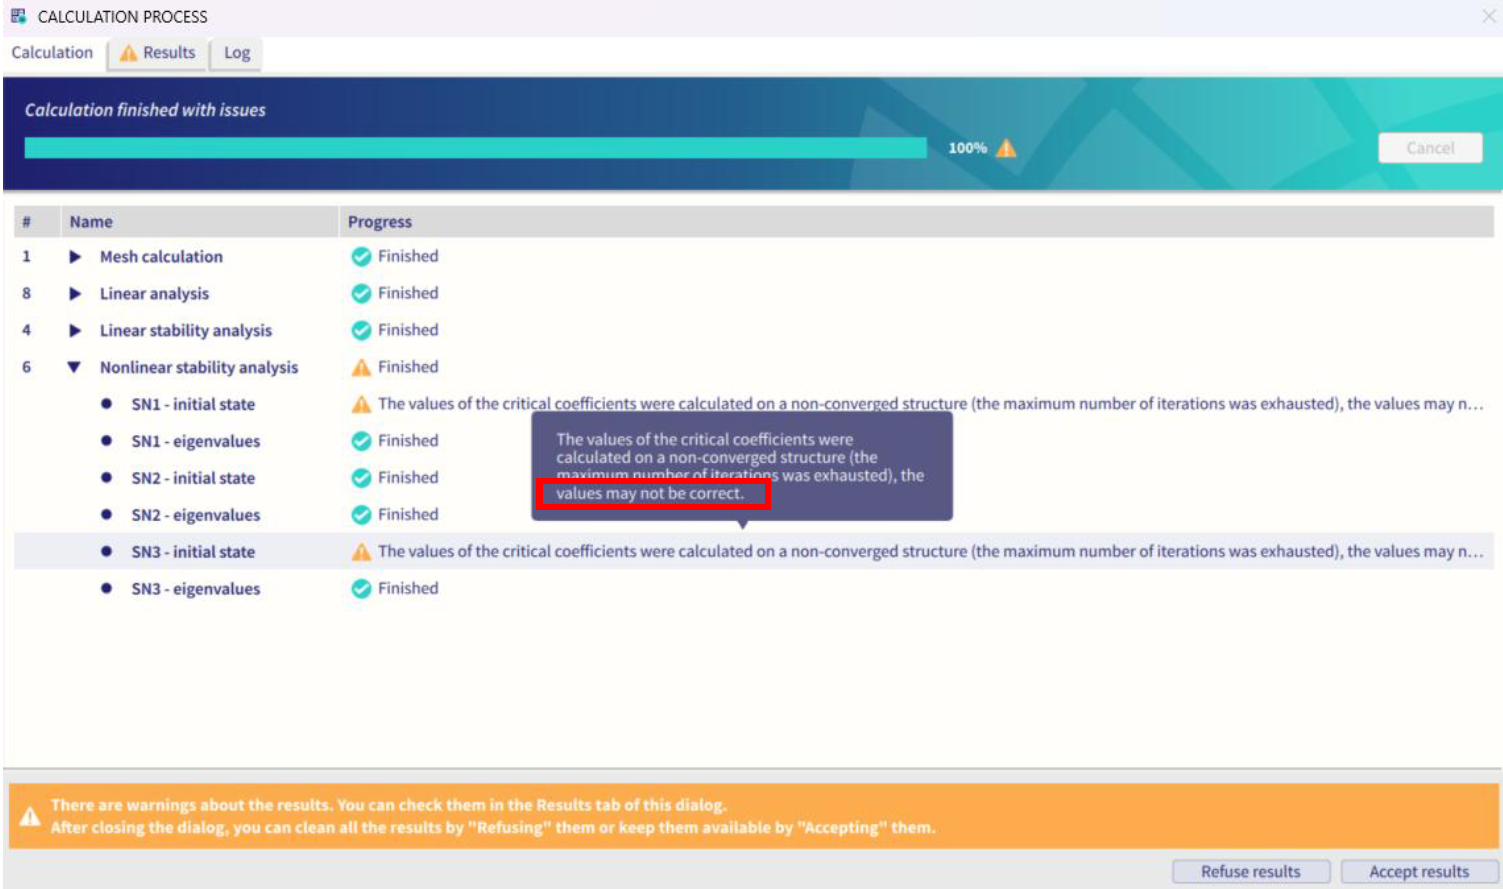
In some cases, nonlinear analysis, nonlinear stability stability or analysis of global imperfections ends with a warning; this can be confusing for users
Instructions
Once the results of these initial state analyses (which are prior to the eigenvalue buckling analyses within the nonlinear stability calculation) are present, the NL_ST_DIAG_TOOL might be used to check the graph of convergence.
Run the latest executable of NL_ST_DIAG_TOOL
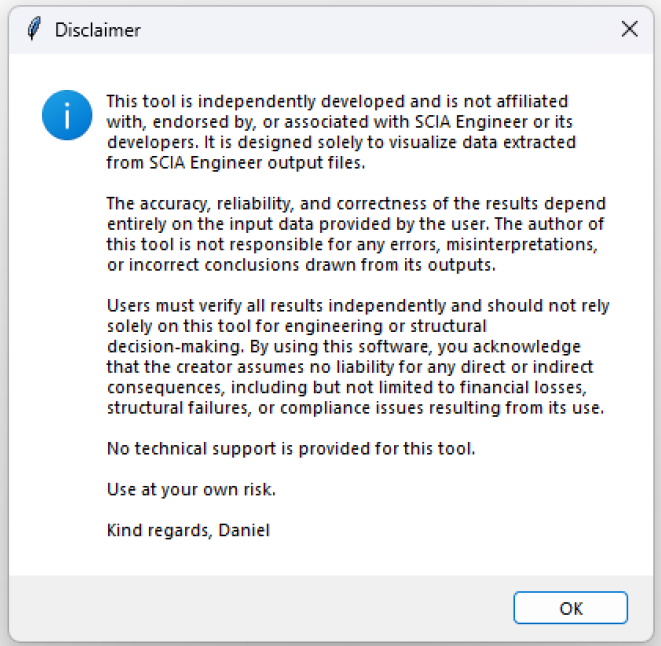
There is a disclaimer upon the opening of the *.exe
Confirm by „OK“
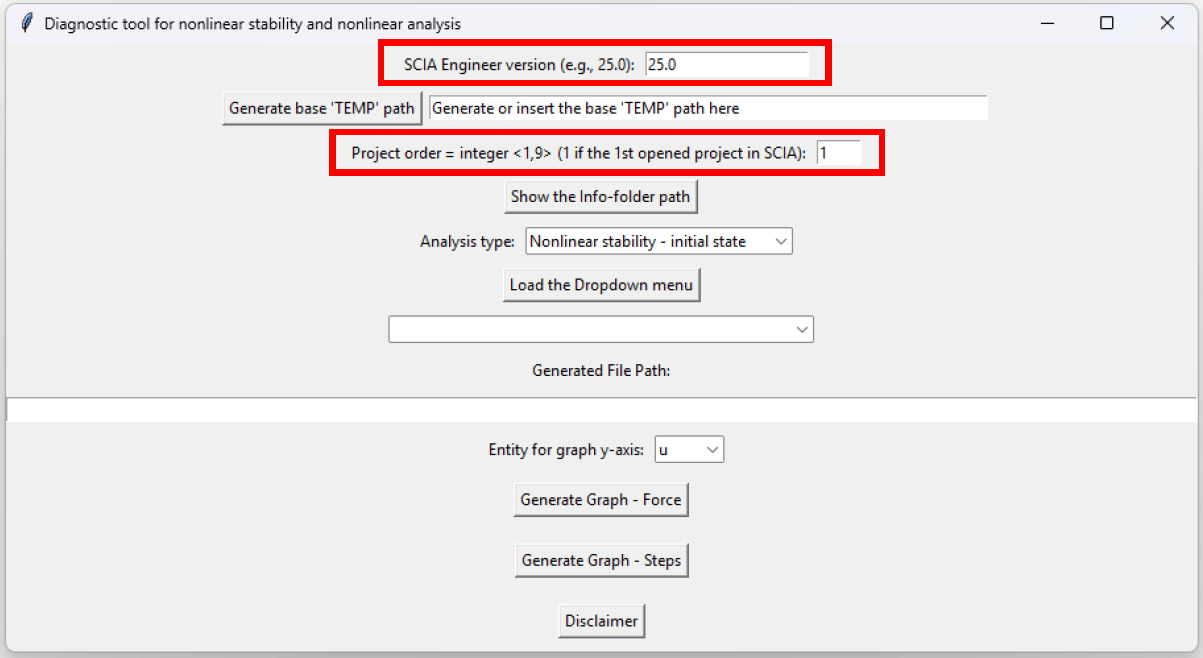
Default values for version and project order are prefilled
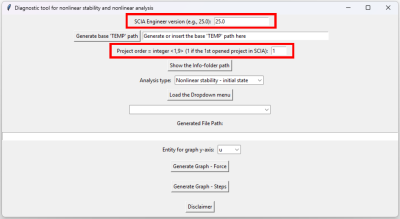
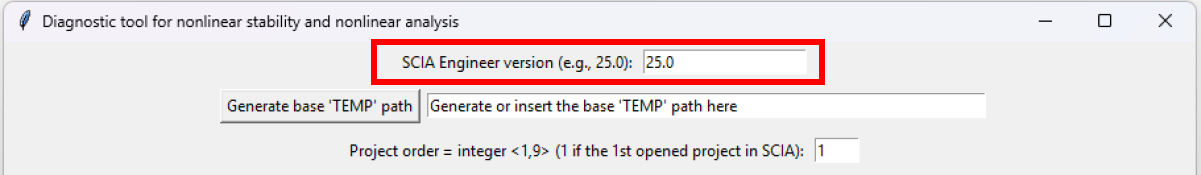
Fill in the SCIA Engineer version (only first 4 symbols, e.g. for 25.0.5008 type 25.0 only) – it will look through the registers where the TEMP folder is located for this version


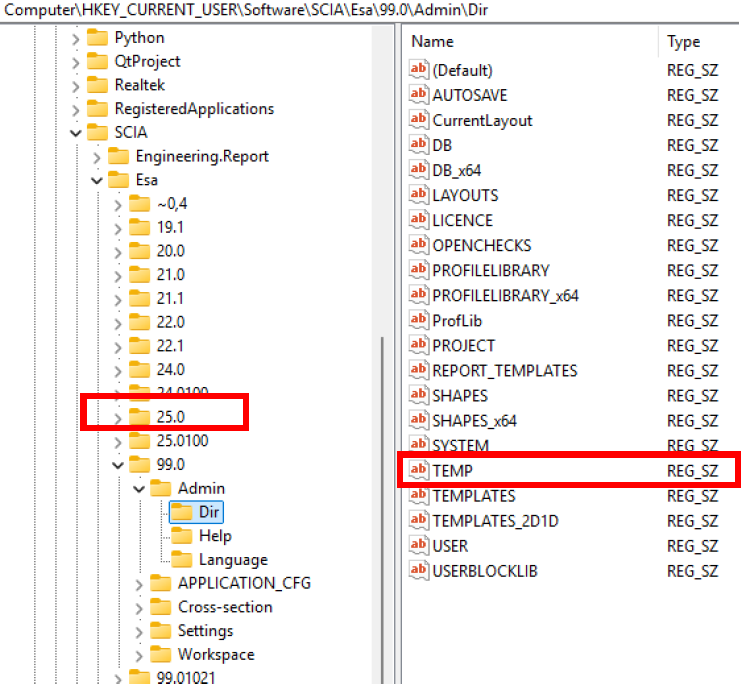
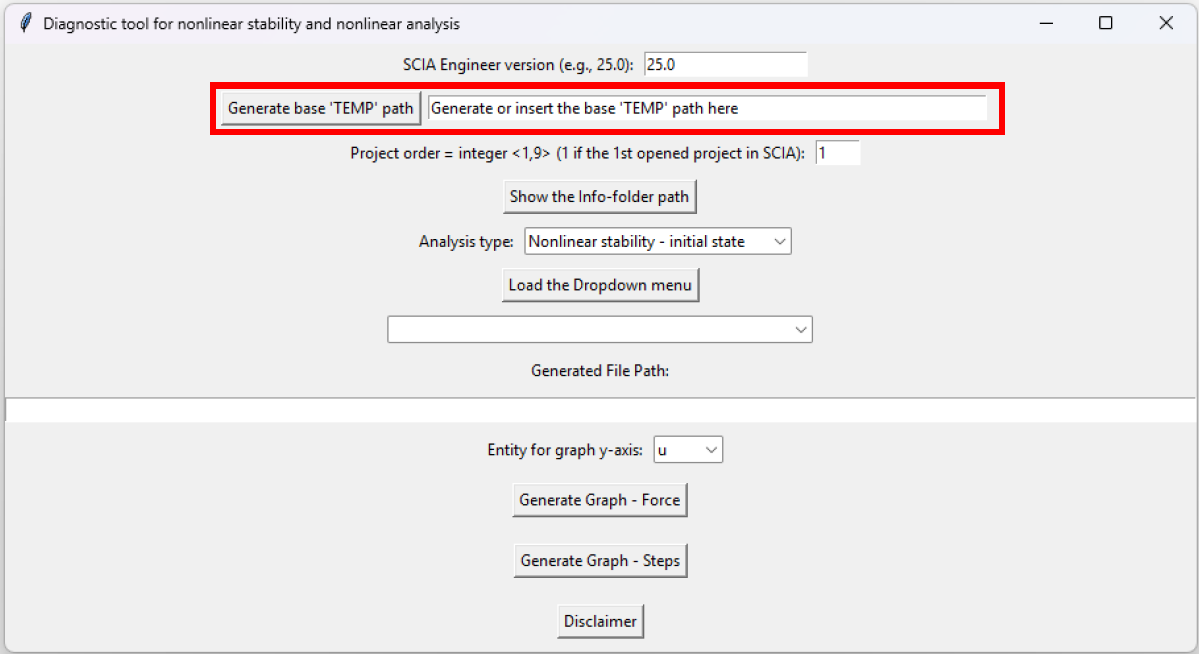
Upon verification of the SCIA Engineer version, click on the button „Generate base ‘TEMP‘ path“.
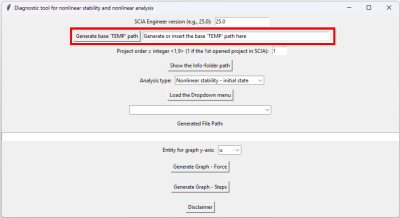
This should read the TEMP path from the registry and provide it in the space right to this button, e.g.:

Type the number of the „Project order“ – usually1.
It is the order of the investigated project (esa file) opened from all currently opened projects in the corresponding SCIA version, respecting any historical closing and opening of various projects.
e.g.: in SCIA 25.0.5008 you have opened project A, afterwards you opened project B. In this case, if you want to investigate results of project B, type 2, as this is the second opened project. Later on, you may open project C while still having A and B opened as well. C will be number 3. Afterwards, you close the project A and B. You open project D. Number for D will be again 1, etc.
Note: default is usually wanted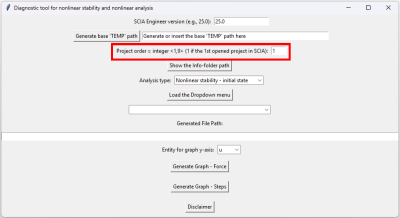
Optional – You can check where in TEMP is the „Info“ folder, from which the information to fill the dropdown menu under the button „Load the Dropdown menu“ is taken from
Note: each currently opened project within the TEMP folder has its own subfolder respecting the order of opening. The number from the input above is the 4th symbol in the name of this subfolder. The tool can work with maximum of 9 opened *.esa projects.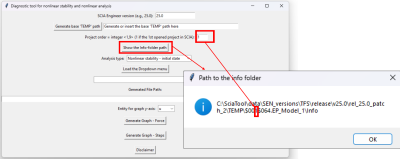
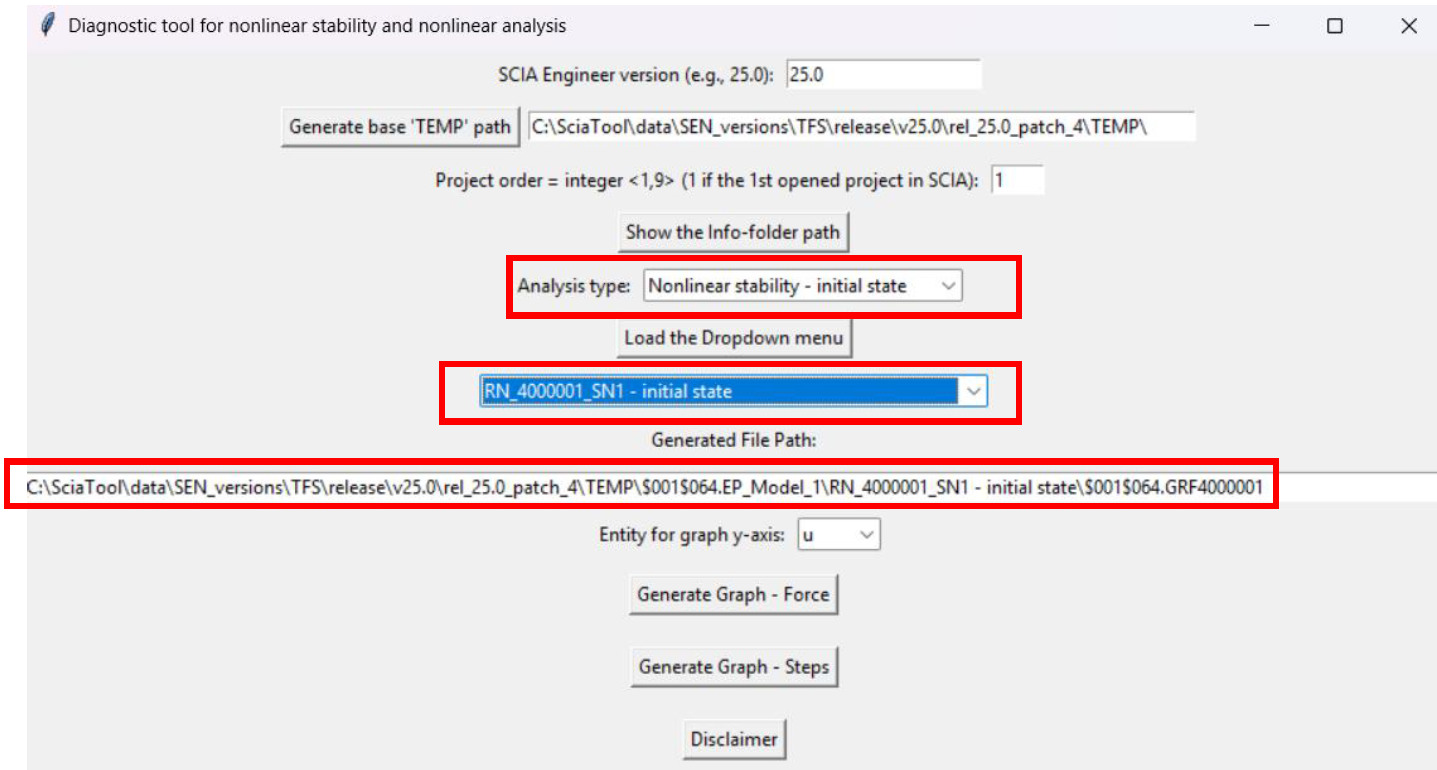
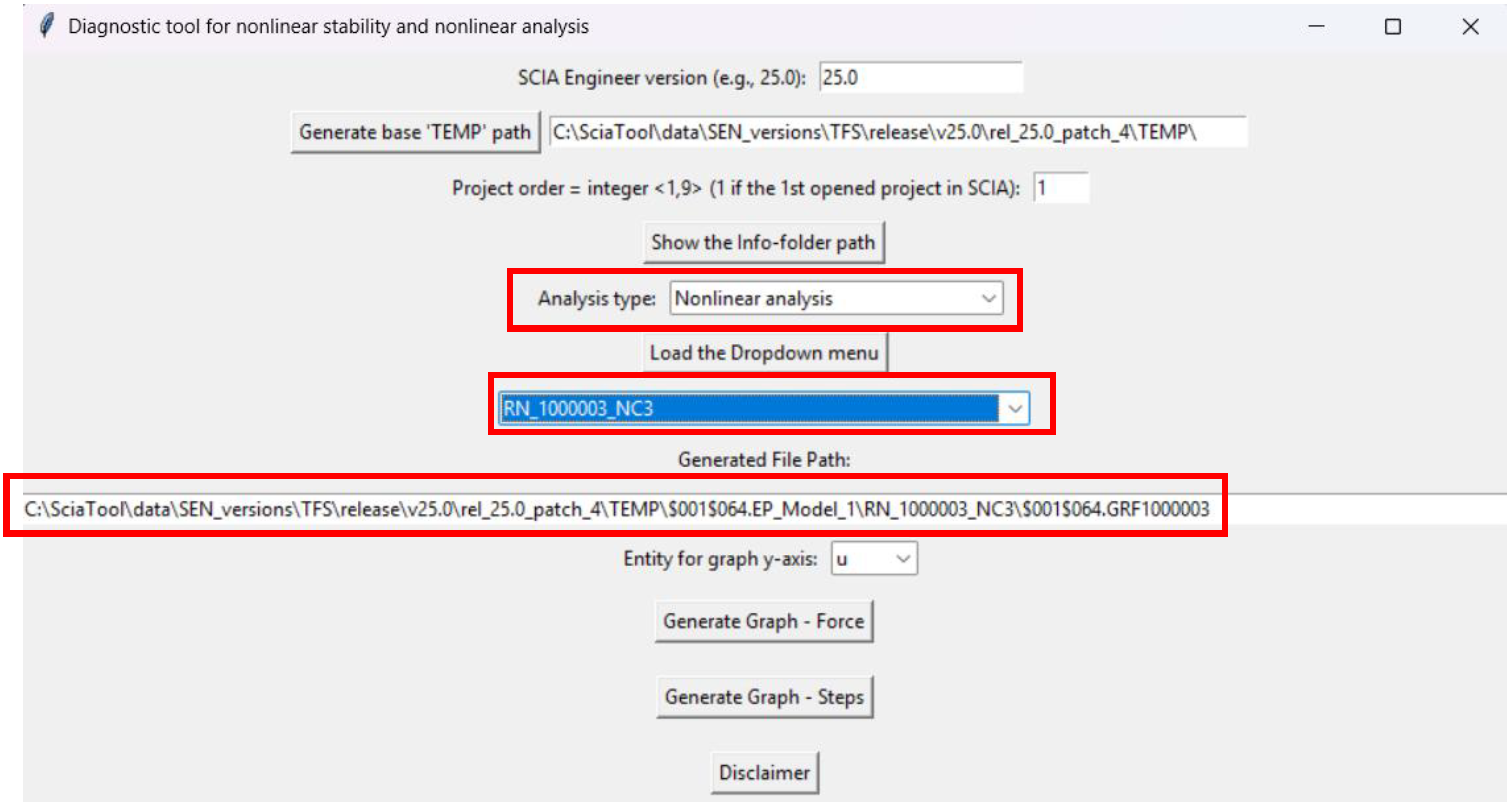
Set the analysis type for which you want to see graph of convergence. Two options are available: „Nonlinear stability – initial state“ and „Nonlinear analysis“.
For nonlinear stability – just keep the corresponding default option
Note: The option to check the graph for standard nonlinear analysis was added just in case the user closes the „calculation process dialogue“ after the analysis and wants to check the convergence graph again. Fur such cases, only convergence graphs of finished nonlinear analyses are provided, as will be explained later.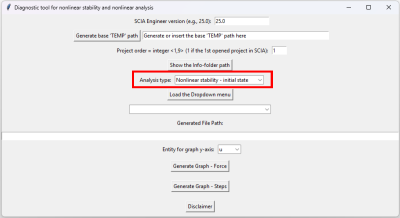
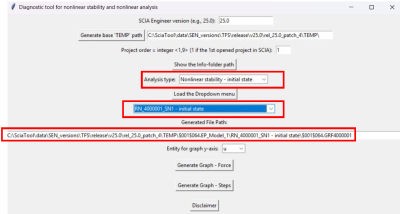
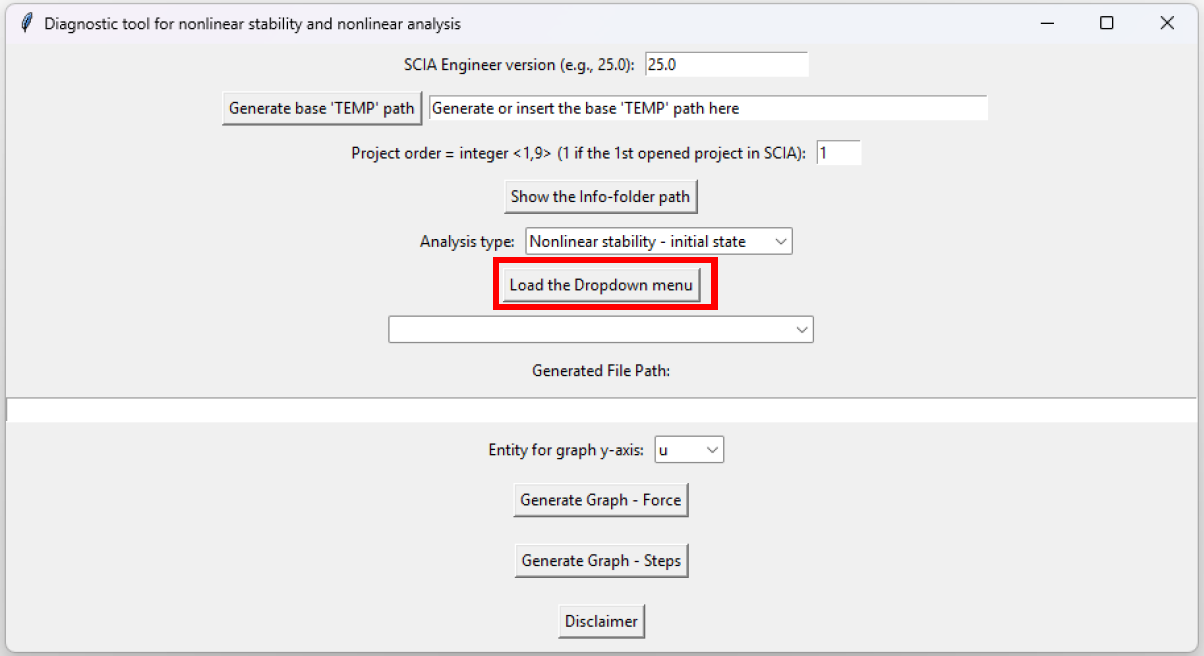
Mostly not necessary – Click on the button „Load the Dropdown menu“
By default, there will be no preselected option, but the list should be updated with the list of all the „initial state“ analyses of the nonlinear stability combinations, or all the nonlinear analyses, based on the above dropdown menu selection
Note: If the dropdown menu next to the „Analysis type“ is changed, the function this button triggers is also automatically triggered, so there is no necessity to click on this button in such case.
Just click on the button if you do not change the default content in the dropdown menu of the „Analysis type“
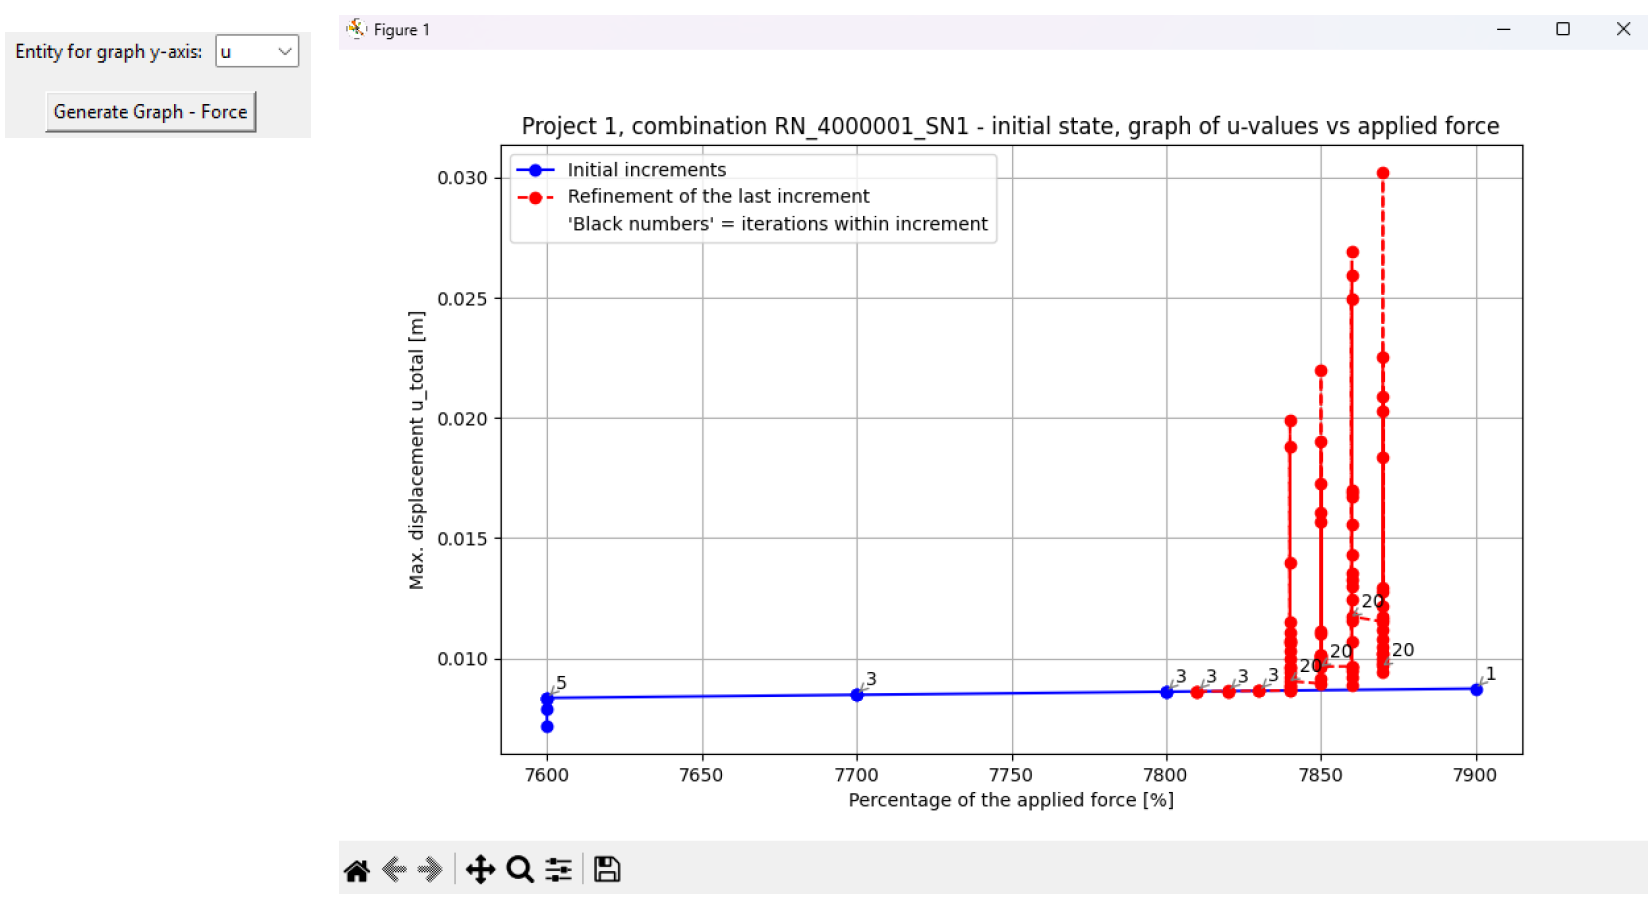
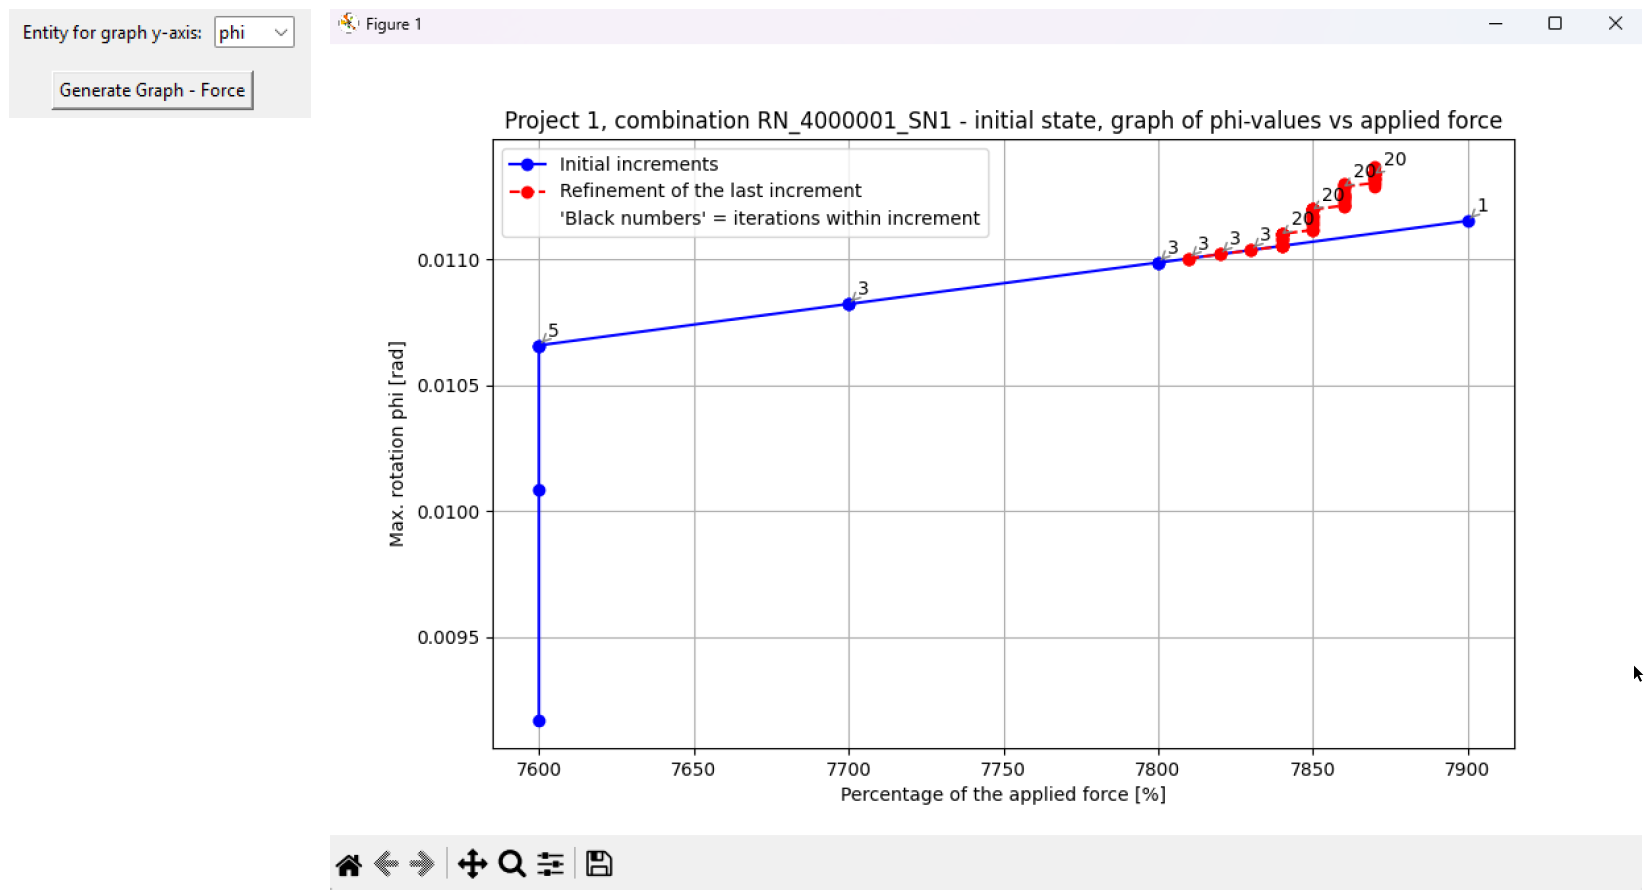
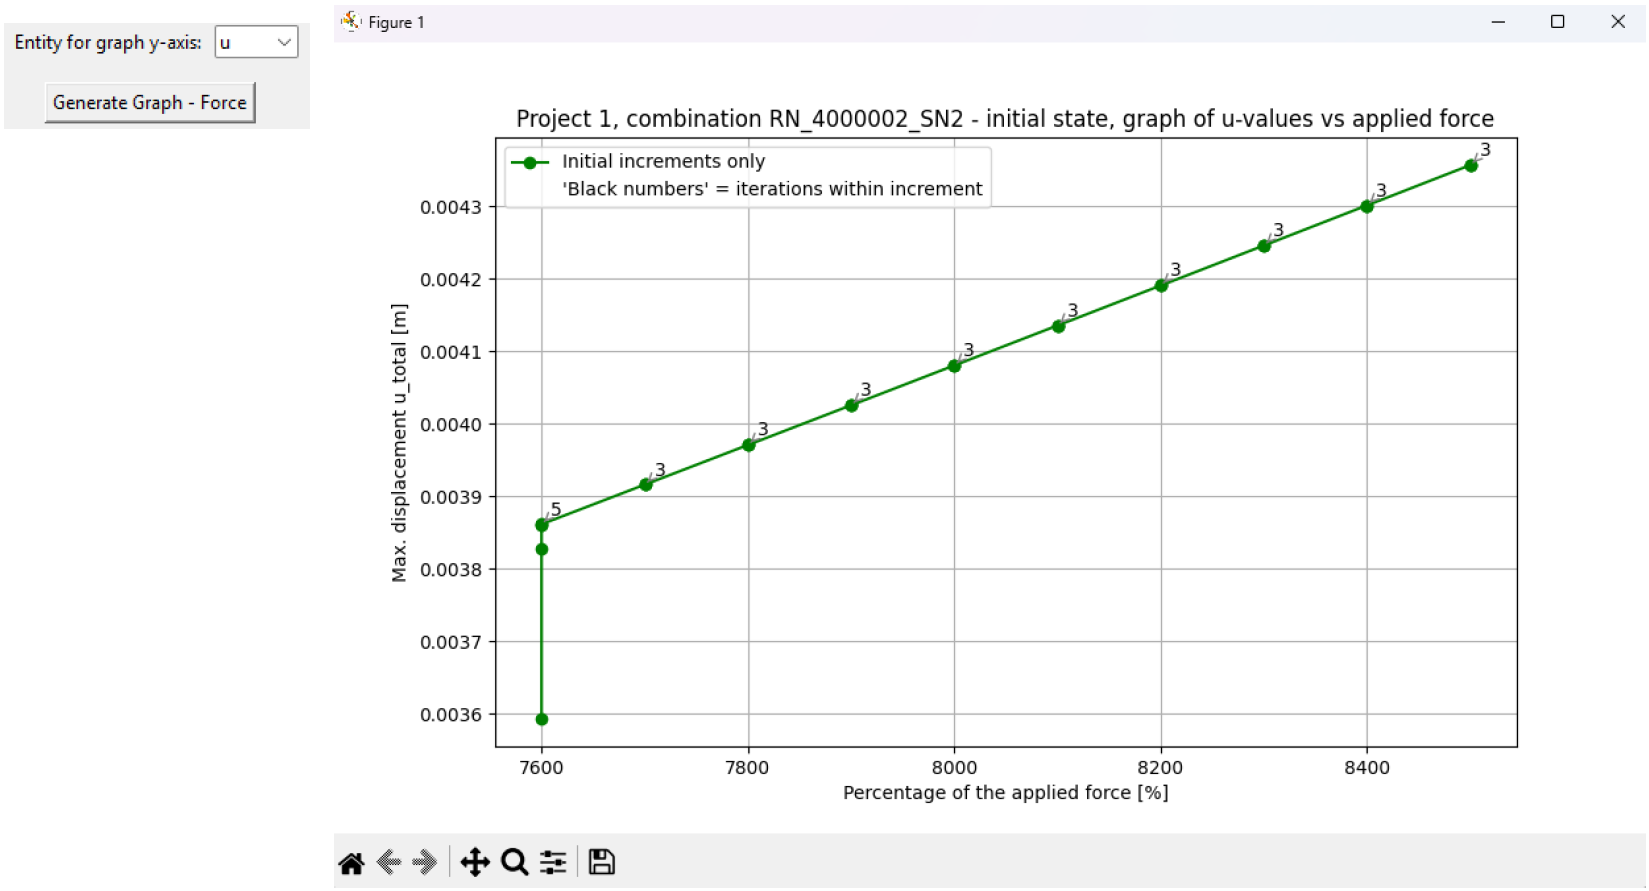
Upon selecting one from the list, the path to the corresponding *.GRF4 xxx xxx file is automatically generated (for nonlinear stability – initial state). This is the file, from which the data are obtained in order to generate the current graphs
Analogically, for nonlinear analysis combinations, the path to the corresponding*.GRF1 xxx xxx files are created:

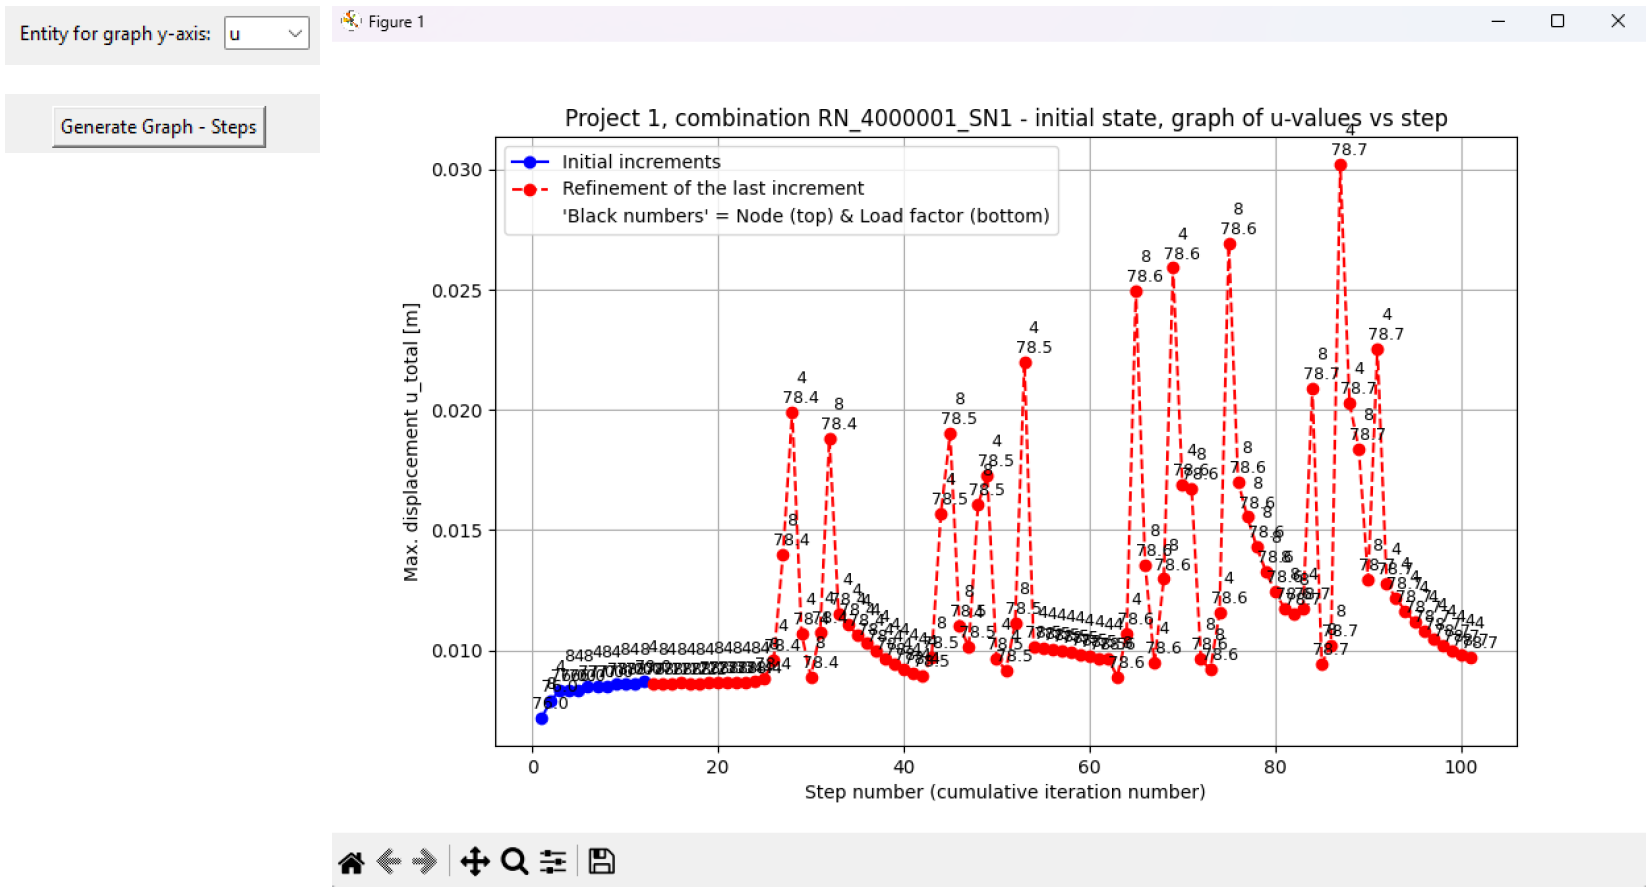
Select the entity for y-axis of the graph – either the displacement „u“ or rotation „phi“

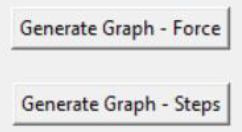
Plot the desired type of graph


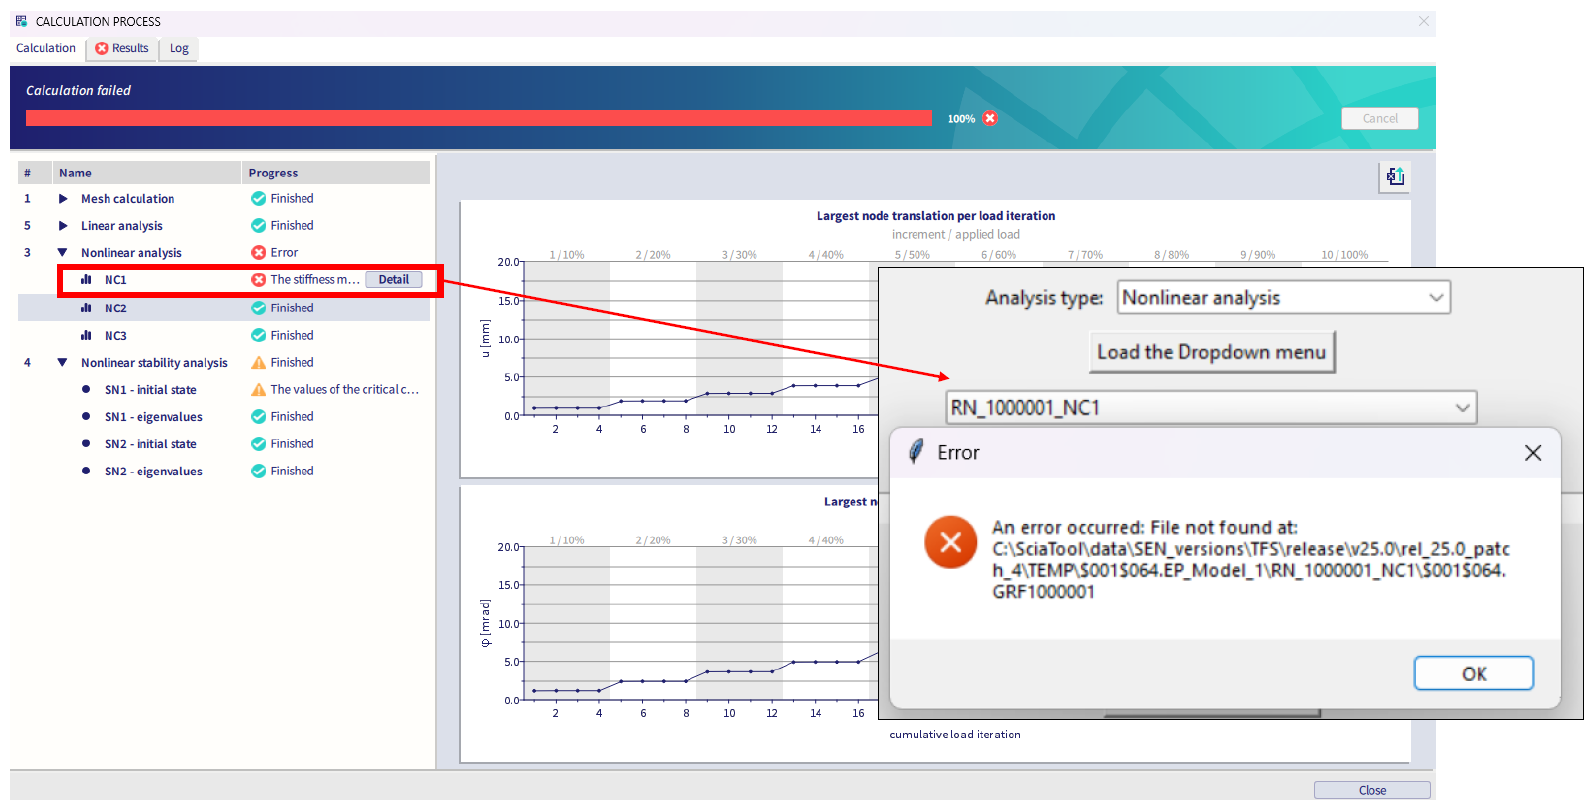
Further notes: In cases of analyses which end with „error“, the graphs through this tool are not provided, as there are no corresponding *.GRFxxxxxxx files in the TEMP folders. In such case an error message is provided:
Release notes:
- v 4.2 (04-2025): possible to check graphs of convergence for nonlinear stability - initial state, and nonlinear analysis
- v 5.0 (06-2025): extending to automatically generate the path to convergence graph file also for 'initial global geometrical imperfection' analysis
- v 6.2 (11-2025): implementation to open .LOG file for the corresponding analysis, basic .LOG file explanation, opening of the *.sm_log file - the global log file for whole the *.esa project.
- v 7.3 (03-2026): automatic handling of cases where two or more analysis results share one folder in the TEMP directory (oddly named folders), a 'Graph to plot' dropdown now lists all available *.GRF files for selection. The SCIA analysis name (e.g. 'BEM 012') is resolved from the Info folder and displayed below the dropdown and used in graph titles for all supported analysis types.
This is not official SCIA software and these community addons are delivered without any warranty or guarantee. So always verify the imported data. If you have any feedback, comments, requests, please feel free to contact us at our e-mail [email protected].
Check convergence of nonlinear (stability) analysis v7.3
Check convergence of nonlinear (stability) analysis
Check convergence of nonlinear (stability) analysis v6.2
Check convergence of nonlinear (stability) analysis