Check (convergence of) nonlinear analysis
With the new solver manager, graphs with the displacements u and rotations fi during the nonlinear analysis are not implemented (yet). Via following procedure you can visualize these graphs in Excel.
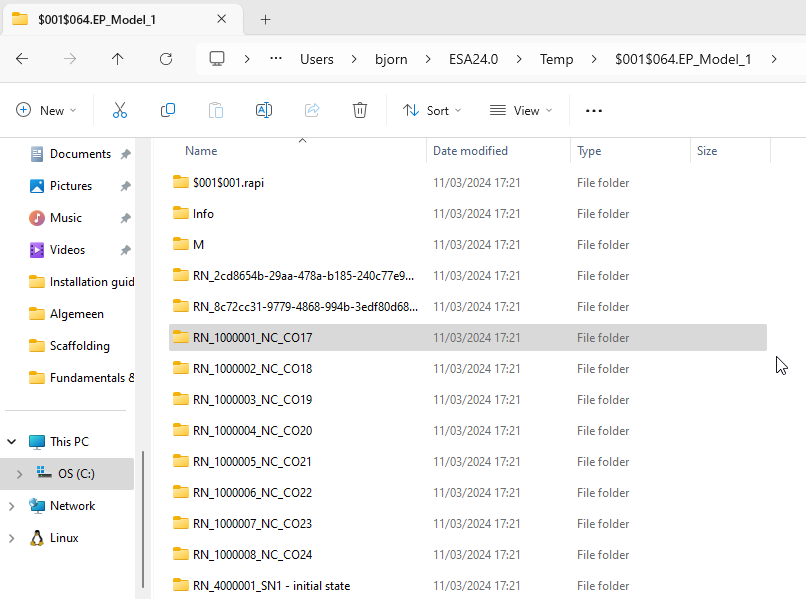
Nonlinear combinations are numbered as 1000001, 1000002,…
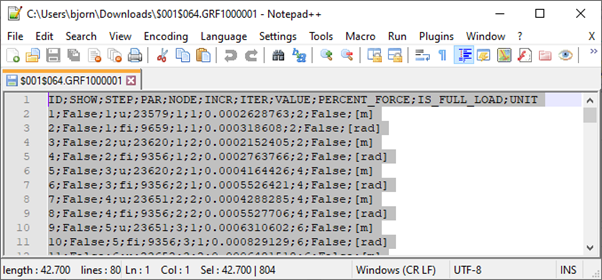
You can open (e.g. in Notepad++) the file $001$064.GRF1000001 of the specific nonlinear combination (in folder C:\Users\*username*\ESA24.0\Temp\$001$064.EP_Model_1 and copy everything. The combination can be named as RN_1000001 or similar (depending on the name of the nonlinear combination):
Open Convergence_graphs_xlsx and paste.
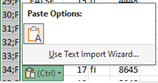
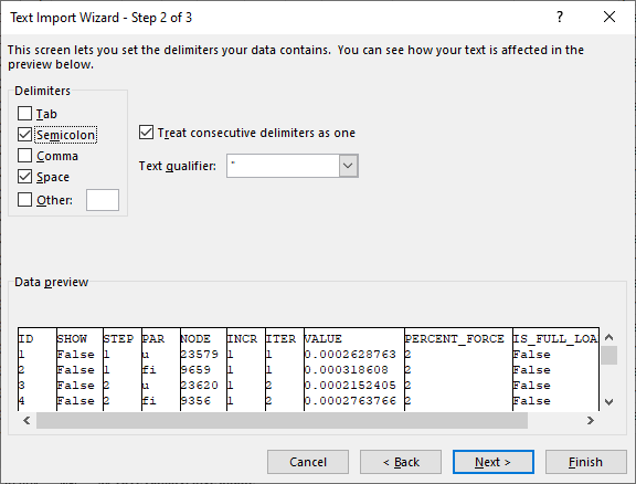
Use the text import wizard to set the Semicolon delimiter:
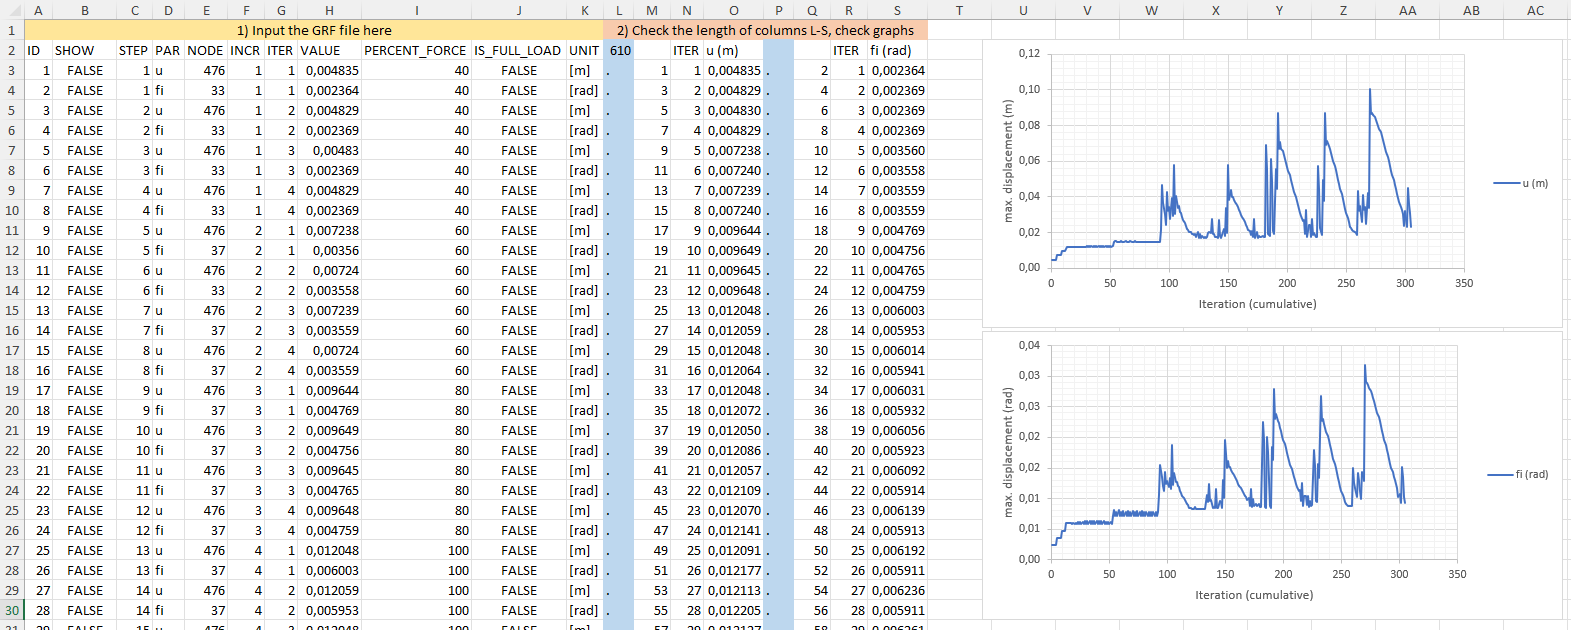
Select the graphs and change the range so everything is plotted well, depending on the amount of data.
Columns F and G indicate the increment number and iteration number (to check if max. number of iterations was reached for that increment).
As result you can see the displacements and rotations: